2013
The DPG has got 62,621 members (status quo 15 February 2013)
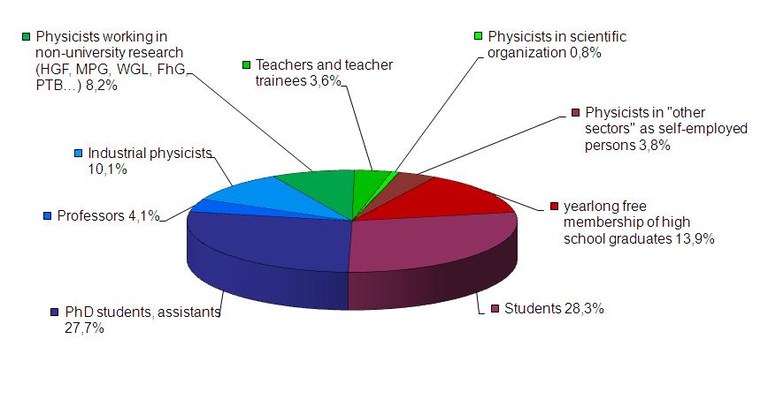
155 members are institutional members (institutes, libraries, schools, companies). The remaining members (99.8%) are personal members, who subdivide in the following way:
| 28.3 % | Students |
| 27.7 % | PhD students, assistents |
| 4.1 % | Professors |
| 10.1 % | Industrial physicists |
| 8.2 % | Physicists working in non-university research (HGF, MPG, FhG, PTB, etc.) |
| 3.6 % | Teachers and teacher trainees |
| 0.8 % | Physicists working in the sector of scientific organisation and administration |
| 3.8 % | Physicists working in other sectors such as self-employed persons |
| 13.9 % | Members from publicity campaigns |
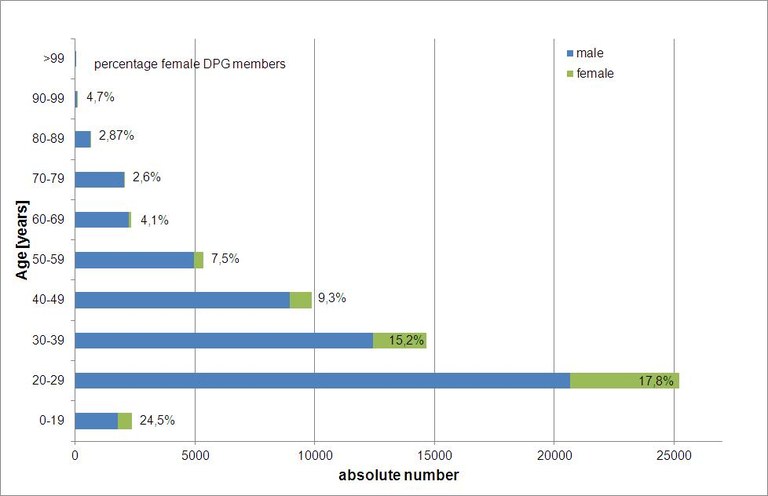
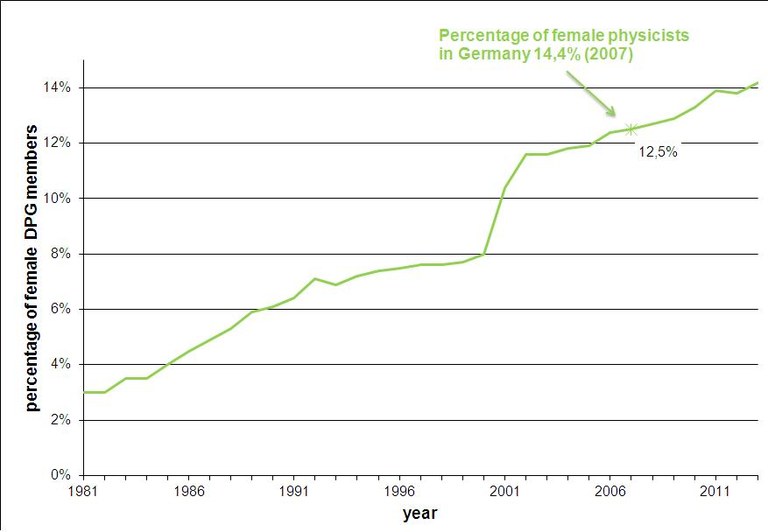
5.8 % of the personal members live abroad. The portion of women is 14.1 %. The median of the age of the members is 31 years, the average 35 years.
Member Structure of the DPG

Age Structure of the DPG

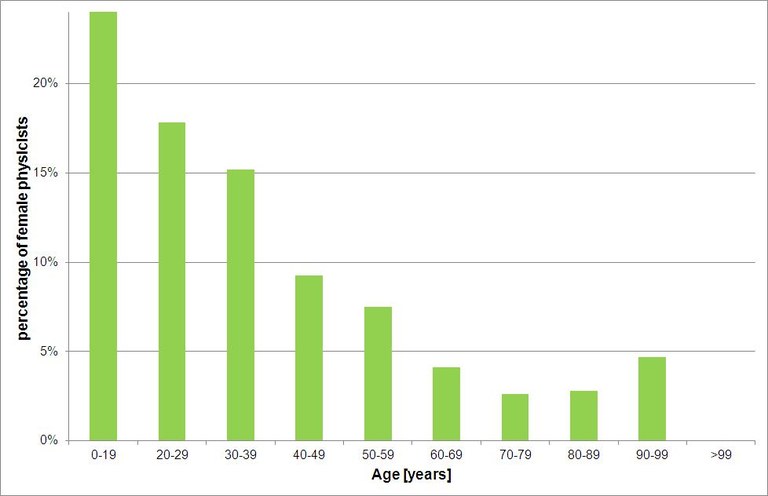
Percentage of Female Physicists within the DPG per Cohort

Percentage of Female Physicists within the DPG
